Porkchop Plots

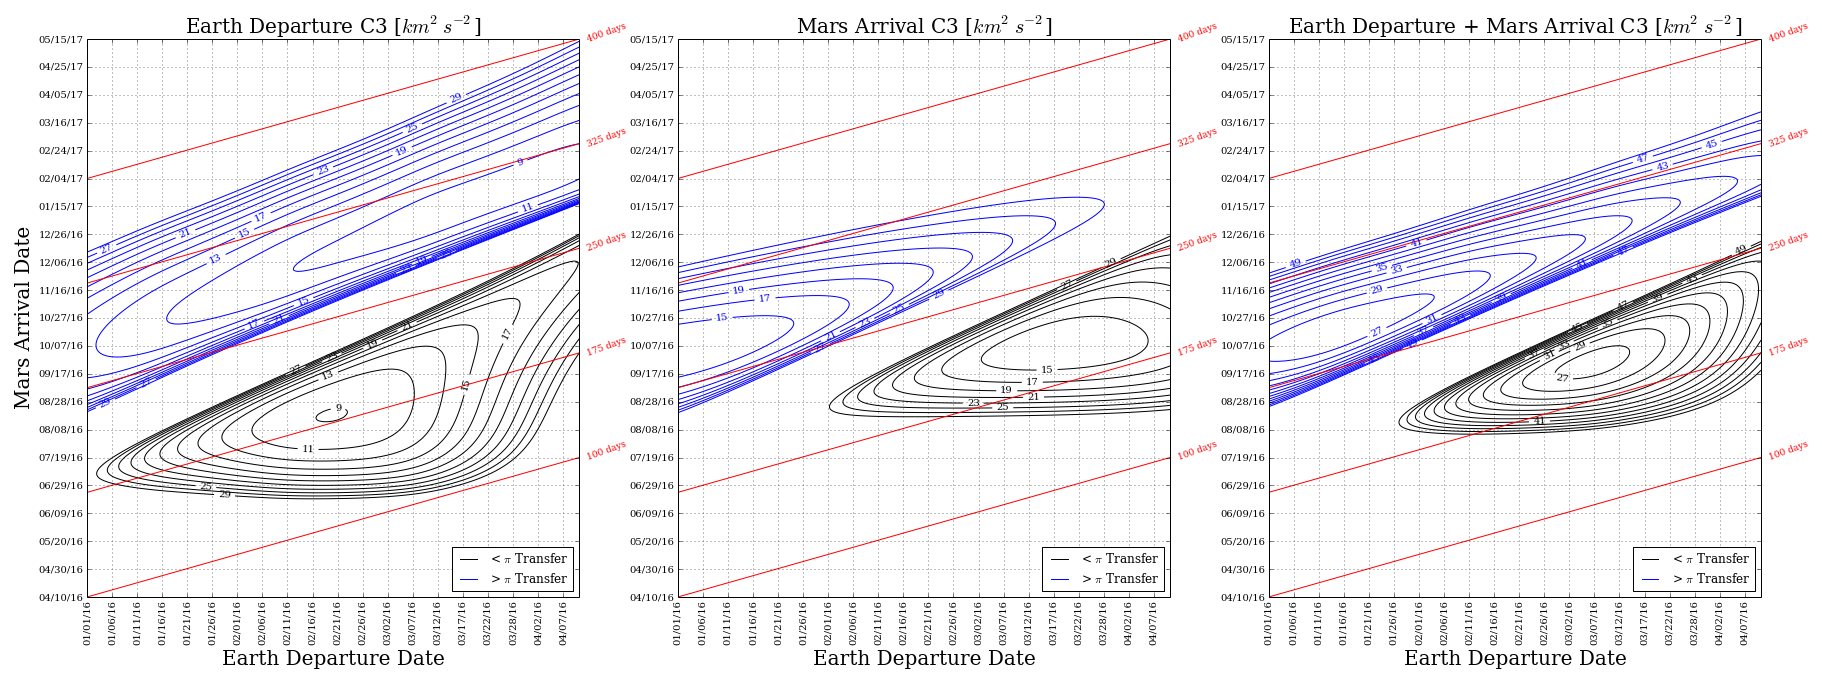
A porkchop plot is a data visualization tool used in interplanetary mission design which displays contours of various quantities as a function of departure and arrival date. Example pork chop plots for 2016 Earth-Mars transfers are shown here. The x-axis is the Earth departure date, and the y-axis is the Mars arrival date. The contours show the Earth departure C3, the Mars arrival C3, and the sum of the two. C3 is the "characteristic energy" of the departure or arrival, and is equal to the \(v_{\infty}^2\) of the hyperbolic trajectory. Each point on the curve represents a ballistic Earth-Mars transfer (computed using a Lambert solver). The two distinct black and blue contours on each plot represent the "short way" (\(<\pi\)) and "long way" (\(>\pi\)) transfers. The contours look vaguely like pork chops, the centers being the lowest C3 value, and thus optimal transfers. The January - October 2016 opportunity will be used for the ExoMars Trace Gas Orbiter, and the March - September 2016 opportunity will be used for InSight.
References
- A. B. Sergeyevsky, G. C. Snyder, R. A. Cunniff, "Interplanetary Mission Design Handbook, Volume I, Part 2: Earth to Mars Ballistic Mission Opportunities, 1990-2005", NASA JPL, September 1983.
- L. M. Burke, R. D. Falck, and M. L. McGuire, "Interplanetary Mission Design Handbook: Earth-to-Mars Mission Opportunities 2026 to 2045", NASA/TM—2010-216764, October 2010.
- Chauncey Uphoff, The History of the Term C3, 2001.