Degenerate Conic

Algorithms • Modern Fortran Programming • Orbital Mechanics

Apr 18, 2015

Fortran and Pyplot

Python's matplotlib.pyplot is a very nice collection of functions that provide an easy Matlab-like interface for data plotting. It can be used to generate quite professional looking plots. There is a lot of information on the internet about calling Fortran from Python, but what if all you want to do is generate some plots from your (modern) Fortran program? With this in mind, I've created a very simple Fortran wrapper for Pyplot, allowing you to make pretty good plots by writing only Fortran code. Consider the following example:

program test

use,intrinsic :: iso_fortran_env, only: wp => real64
use pyplot_module

implicit none

real(wp),dimension(100) :: x,sx,cx,tx
type(pyplot) :: plt
integer :: i

!generate some data:
x = [(real(i,wp), i=0,size(x)-1)]/5.0_wp
sx = sin(x)
cx = cos(x)
tx = sx * cx

!plot it:
call plt%initialize(grid=.true.,xlabel='angle (rad)',&
                    title='python_plot test',legend=.true.)
call plt%add_plot(x,sx,label='\$\sin (x)\$',&
                  linestyle='b-o',markersize=5,linewidth=2)
call plt%add_plot(x,cx,label='\$\cos (x)\$',&
                  linestyle='r-o',markersize=5,linewidth=2)
call plt%add_plot(x,tx,label='\$\sin (x) \cos (x)\$',&
                  linestyle='g-o',markersize=2,linewidth=1)
call plt%savefig('test.png')

end program test

The main user interface is the pyplot class, which has methods such as initialize, add_plot, and savefig. This example produces the following plot:

test

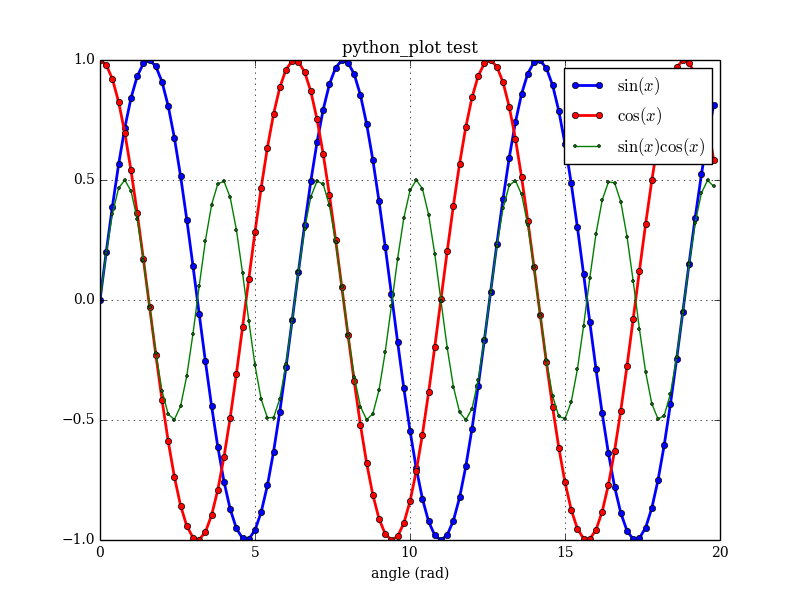
All the module does is generate a Python script, and then runs it and saves the result. The Python call is completely transparent to the Fortran user.

I posted the project to GitHub (pyplot-fortran). Maybe someone else will find it useful, or help to expand it.

See also

  1. matplotlib
  2. F2PY Users Guide and Reference Manual --Fortran to Python interface generator

Oct 18, 2014

Midpoint Circle Algorithm

circle

The Midpoint circle algorithm is a clever and efficient way of drawing a circle using only addition, subtraction, and bit shifts. It is based on the Bresenham line algorithm developed by Jack Bresenham in 1962 at IBM.

The algorithm was also independently discovered by Apple programmer Bill Atkinson in 1981 when developing QuickDraw for the original Macintosh.

A Fortran implementation is given below (which was used to draw the circle shown here, which has a radius of 7 pixels):

subroutine draw_circle(x0, y0, radius, color)

implicit none

integer,intent(in) :: x0, y0, radius, color

integer :: x,y,err

x = radius
y = 0
err = 1-x

do while (x >= y)

    call color_pixel( x + x0, y + y0, color)
    call color_pixel( y + x0, x + y0, color)
    call color_pixel( -x + x0, y + y0, color)
    call color_pixel( -y + x0, x + y0, color)
    call color_pixel( -x + x0, -y + y0, color)
    call color_pixel( -y + x0, -x + y0, color)
    call color_pixel( x + x0, -y + y0, color)
    call color_pixel( y + x0, -x + y0, color)

    y = y + 1

    if (err<0) then
        err = err + 2 * y + 1
    else
        x = x - 1
        err = err + 2 * (y - x + 1)
    end if

end do

end subroutine draw_circle

References

  1. Jack E. Bresenham, "Algorithms for Computer Control of a Digital Plotter", IBM System Journal, 1965.

Jul 29, 2014

Revenge of the Animated GIF

animated_gif_1

Yes, now animated GIFs can be created using only Fortran code. I present FGIF, now on GitHub. It is a modified and updated version of the public domain code found on the Fortran Wiki. It was used to create the image shown here (which is an example of a circle illusion).

For more information on the GIF format, see:

It was interesting to discover that animated GIFs are actually a Netscape extension to the GIF file format. If you open any animated GIF in a hex editor, you will find the string "NETSCAPE2.0".