DDEABM is variable step size, variable order Adams-Bashforth-Moulton PECE solver for integrating a system of first order ordinary differential equations [1-2]. It is a public-domain code originally developed in the 1970s-1980s, written in FORTRAN 77, and is available from Netlib (as part of the SLATEC Common Mathematical Library). DDEABM is primarily designed to solve non-stiff and mildly-stiff differential equations when derivative evaluations are expensive, high accuracy results are needed or answers at many specific points are required. It is based on the earlier ODE/STEP/INTRP codes described in [3-4].
DDEABM is a great code, but like many of the greats of Fortran, it seems to have been frozen in amber for 30 years. There are a couple of translations into other programming languages out there such as IDL and Matlab. It is also the ancestor of the Matlab ode113 solver (indeed, they were both written by the same person [5]). But, it looks like poor Fortran users have been satisfied with using it as is, in all its FORTRAN 77 glory.
So, I've taken the code and significantly refactored it to bring it up to date to modern standards (Fortran 2003/2008). This is more than just a conversion from fixed to free-form source. The updated version is now object-oriented and thread-safe, and also has a new event finding capability (there is a version of this code that had root-finding capability, but it seems to be based on an earlier version of the code, and also has some limitations such as a specified maximum number of equations). The new event finding feature incorporates the well-known ZEROIN algorithm [6-7] for finding a root on a bracketed interval. Everything is wrapped up in an easy-to-use class, and it also supports the exporting of intermediate integration points.
The new code is available on GitHub and is released under a permissive BSD-style license. It is hoped that it will be useful. There are some other great ODE codes that could use the same treatment (e.g. DLSODE/DVODE from ODEPACK, DIVA from MATH77, and DOP853 from Ernst Hairer).
References
- L. F. Shampine, H. A. Watts, "DEPAC - Design of a user oriented package of ode solvers", Report SAND79-2374, Sandia Laboratories, 1979.
- H. A. Watts, "A smoother interpolant for DE/STEP, INTRP and DEABM: II", Report SAND84-0293, Sandia Laboratories, 1984.
- L. F. Shampine, M. K. Gordon, "Solving ordinary differential equations with ODE, STEP, and INTRP", Report SLA-73-1060, Sandia Laboratories, 1973.
- L. F. Shampine, M. K. Gordon, "Computer solution of ordinary differential equations, the initial value problem", W. H. Freeman and Company, 1975.
- L. F. Shampine and M. W. Reichelt, "The MATLAB ODE Suite" [MathWorks].
- R. P. Brent, "An algorithm with guaranteed convergence for finding a zero of a function", The Computer Journal, Vol 14, No. 4., 1971.
- R. P. Brent, "Algorithms for minimization without derivatives", Prentice-Hall, Inc., 1973.
Python's matplotlib.pyplot is a very nice collection of functions that provide an easy Matlab-like interface for data plotting. It can be used to generate quite professional looking plots. There is a lot of information on the internet about calling Fortran from Python, but what if all you want to do is generate some plots from your (modern) Fortran program? With this in mind, I've created a very simple Fortran wrapper for Pyplot, allowing you to make pretty good plots by writing only Fortran code. Consider the following example:
program test

use,intrinsic :: iso_fortran_env, only: wp => real64
use pyplot_module

implicit none

real(wp),dimension(100) :: x,sx,cx,tx
type(pyplot) :: plt
integer :: i

!generate some data:
x = [(real(i,wp), i=0,size(x)-1)]/5.0_wp
sx = sin(x)
cx = cos(x)
tx = sx * cx

!plot it:
call plt%initialize(grid=.true.,xlabel='angle (rad)',&
                    title='python_plot test',legend=.true.)
call plt%add_plot(x,sx,label='\$\sin (x)\$',&
                  linestyle='b-o',markersize=5,linewidth=2)
call plt%add_plot(x,cx,label='\$\cos (x)\$',&
                  linestyle='r-o',markersize=5,linewidth=2)
call plt%add_plot(x,tx,label='\$\sin (x) \cos (x)\$',&
                  linestyle='g-o',markersize=2,linewidth=1)
call plt%savefig('test.png')

end program test
The main user interface is the pyplot class, which has methods such as initialize, add_plot, and savefig. This example produces the following plot:
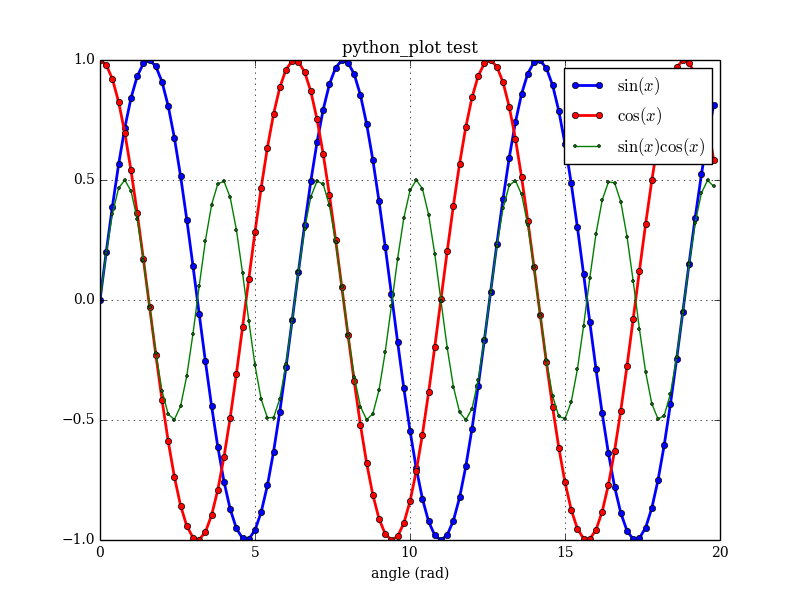
All the module does is generate a Python script, and then runs it and saves the result. The Python call is completely transparent to the Fortran user.
I posted the project to GitHub (pyplot-fortran). Maybe someone else will find it useful, or help to expand it.
See also
- matplotlib
- F2PY Users Guide and Reference Manual --Fortran to Python interface generator
Here is a simple Fortran subroutine to return only the unique values in a vector (inspired by Matlab's unique function). Note, this implementation is for integer arrays, but could easily be modified for any type. This code is not particularly optimized, so there may be a more efficient way to do it. It does demonstrate Fortran array transformational functions such as pack and count. Note that to duplicate the Matlab function, the output array must also be sorted.
subroutine unique(vec,vec_unique)
! Return only the unique values from vec.

implicit none

integer,dimension(:),intent(in) :: vec
integer,dimension(:),allocatable,intent(out) :: vec_unique

integer :: i,num
logical,dimension(size(vec)) :: mask

mask = .false.

do i=1,size(vec)

    !count the number of occurrences of this element:
    num = count( vec(i)==vec )

    if (num==1) then
        !there is only one, flag it:
        mask(i) = .true.
    else
        !flag this value only if it hasn't already been flagged:
        if (.not. any(vec(i)==vec .and. mask) ) mask(i) = .true.
    end if

end do

!return only flagged elements:
allocate( vec_unique(count(mask)) )
vec_unique = pack( vec, mask )

!if you also need it sorted, then do so.
! For example, with slatec routine:
!call ISORT (vec_unique, [0], size(vec_unique), 1)

end subroutine unique